Insights - AI & Automation Report
Last updated: September 16, 2026
AI & Automation Report: This article provides an overview of the 'AI & Automation' report within GoodTime's Insights Tab
TL;DR: the new AI and Automation Reports to measure workflow automation across your recruitment process. These reports help you track how much of your recruiting work is being automated versus done manually—from requesting candidate availability to confirming interviews. The reports include an ROI calculator that shows the time and cost savings your organization is gaining from automation adoption.
AI & Automation 101:
The 'AI and Automation Reports' are designed to provide insights into the percentage of actions that are automated versus manual across key workflow steps including requesting availability, scheduling interviews, rescheduling interviews, and replacing interviewers.The reports measure automation adoption with a dedicated ROI calculator, allowing you to see exactly how many hours and dollars your team is saving through GoodTime's automated workflows.
Each metric is broken down with clear definitions of what qualifies as "automated" versus "manual" to ensure you understand how the data is being calculated.
The report includes customizable parameters (time per action and hourly rates) that you can adjust to match your organization's specific values and see personalized savings calculations.
All data displayed uses a 90-day default lookback window, with the ability to adjust the date range to view trends over different periods.
The reports can be filtered and broken down by time period (daily, weekly, monthly, quarterly) to track your automation progress over time.
🎥 The following video provides an overview of the AI & Automation Report:
[VIDEO COMING SOON]
How to Navigate to Load Balance Report
Navigate to GoodTime.
Click on the Insights menu in the top right corner.
Look for AI Agents section and locate the AI and Automation Reports box.
Select the AI and Automation Reports from the available options.
📈 Understanding the Metrics
Requesting Availability
Requesting Availability measures how much of your candidate availability collection is automated:
Automated: When GoodTime reaches out to candidates to request their availability without manual coordinator involvement via automated workflows.
Manual: When coordinators are manually collecting availability by having candidates use Schedule Now or other manual methods.
Customers using request availability workflows will show higher automation percentages, while those relying on manual collection will show lower percentages (0-100%).
Scheduling Interviews
Scheduling Interviews is broken down into how interviews move from request to confirmation:
Automated: Interviews that flow from request availability → confirmed, request availability → hold, or hold → auto-confirmed.
Manual: Interviews scheduled through manual coordinator intervention.
Note: Some organizations (like Atlassian) may show high automation percentages because they use auto-confirmation settings, even though much of their workflow is manual. This metric may be further refined in future updates based on customer feedback.
Rescheduling Interviews
Rescheduling Interviews tracks candidate-initiated and coordinator-initiated reschedules:
Automated: When candidates reschedule themselves through GoodTime's self-service portal.
Manual: When coordinators reschedule interviews on behalf of candidates.
Replacing Interviewers
Replacing Interviewers measures how often interviewer replacements are automated:
Automated: When the system auto-replaces interviewers based on availability and your configured rules.
Manual: When coordinators manually replace interviewers.
💰 ROI Calculator & Customizable Parameters
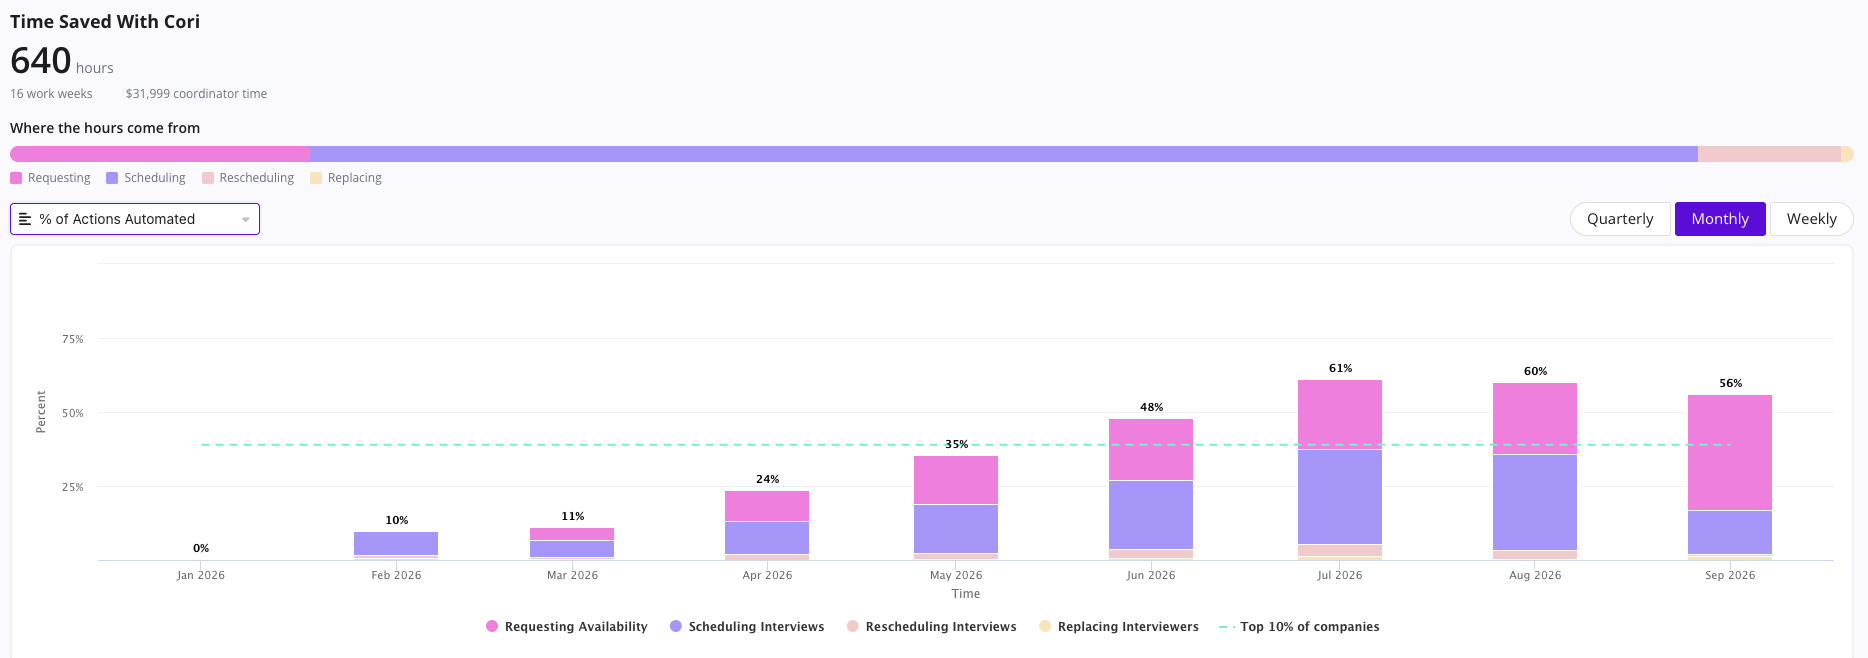
The right side of the report displays default time and cost values that you can customize:
Default values included:
Request Availability: 5 minutes
Scheduling Interviews: 15 minutes
Rescheduling Interviews: 12 minutes
Replacing Interviewers: 5 minutes
Hourly Rate: $50/hour
Your team can adjust these parameters to reflect your organization's actual time investments and compensation rates. When you modify these values, the ROI calculations and charts update in real-time to show your personalized savings metrics.
📊 Tracking Automation Adoption Over Time
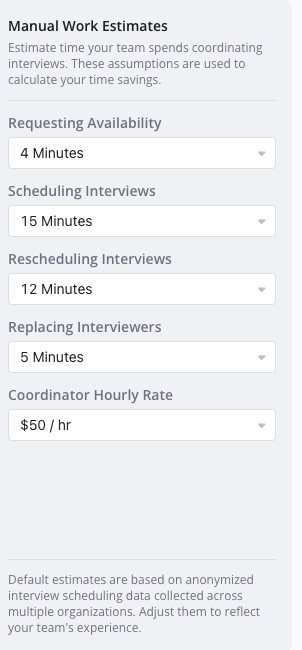
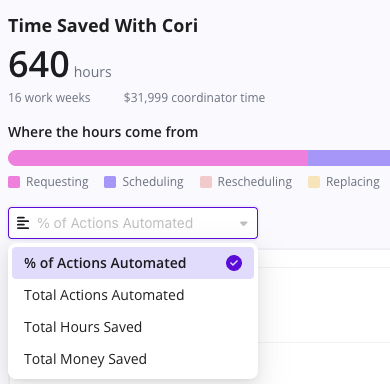
The automation graph shows the percentage of actions being automated, with several viewing options:
Percentage View (Default): Shows your automation percentage against a benchmark of the top 10% of GoodTime customers, helping you understand where you stand relative to industry leaders.
Volume View: Shows the total number of automated actions over the same period, allowing you to track growth in absolute terms rather than just percentages.
Time Saved View: Displays automation savings in hours—showing how many hours your team has saved through automation.
Money Saved View: Converts time savings to dollar amounts based on your configured hourly rates.
Total Actions View: Shows the complete volume of actions (automated + manual) to give context to your automation metrics.
You can break down the graph by:
Weekly
Monthly
Quarterly
Adjusting these time periods helps you identify trends and track your progress toward higher automation adoption.
💡 Key Insights from the Report
Industry Benchmarking: The default benchmark shows how the top 10% of GoodTime customers are automating their workflows. Use this as a goal to understand where optimization opportunities exist in your process.
Customizable Calculations: By adjusting your hourly rates and time-per-action values, you can see realistic ROI numbers that match your organization's specific circumstances.
Period-over-Period Comparison: Tracking changes week-over-week, month-over-month, or quarter-over-quarter helps you measure the impact of new automations you've implemented.
Data Availability: Data collection started in March. While some data may appear before this date, March forward is where reliable historical data begins. Future backfilling will occur once customer feedback shapes how the data should be visualized and broken down.
💬 Sharing & Saving Reports
You can save and share these reports with your team:
Export metrics for presentations or stakeholder reviews
Share specific time periods to highlight automation wins
Use the reports to guide decisions about which workflows to automate next
Tooltips are available throughout the report to help clarify metrics and calculations.
🎯 Final Takeaway
These AI and Automation Reports give you complete visibility into your automation adoption and ROI. With easy-to-use filtering and customizable calculations, you can:
Measure exactly how much of your recruiting process is automated versus manual.
Quantify the time and cost savings from your automation efforts.
Benchmark your progress against industry leaders.
Identify workflows with the highest automation potential.
This helps you make data-driven decisions about where to invest in further automation for maximum impact.